Less Planes, More Seats? How Low-Cost Carriers Helped Increase Industry Capacity
The industry is at the same airline capacity as 2019, but with fewer scheduled flights. How is this possible?
Photo: Courtesy of PLAY
Despite the global airline industry being significantly impacted by the pandemic, recent data from OAG reveals a remarkable resilience: The capacity for airlines has not only recovered but has now exceeded pre-pandemic levels seen in 2019.
This achievement, however, is even more impressive, considering that the actual number of scheduled flights remains lower than before the pandemic. The average capacity per flight has increased by 8 percent in Q4 2024, resulting in 160 seats per flight.
Less Planes, More Seats?
Several factors have played a crucial role in this capacity increase. The availability of resources and aircraft, coupled with the rise of low-cost carriers, has been instrumental, according to OAG. Additionally, the reduction in regional flights and the supply issues regarding aircraft spare parts have also contributed to this trend.
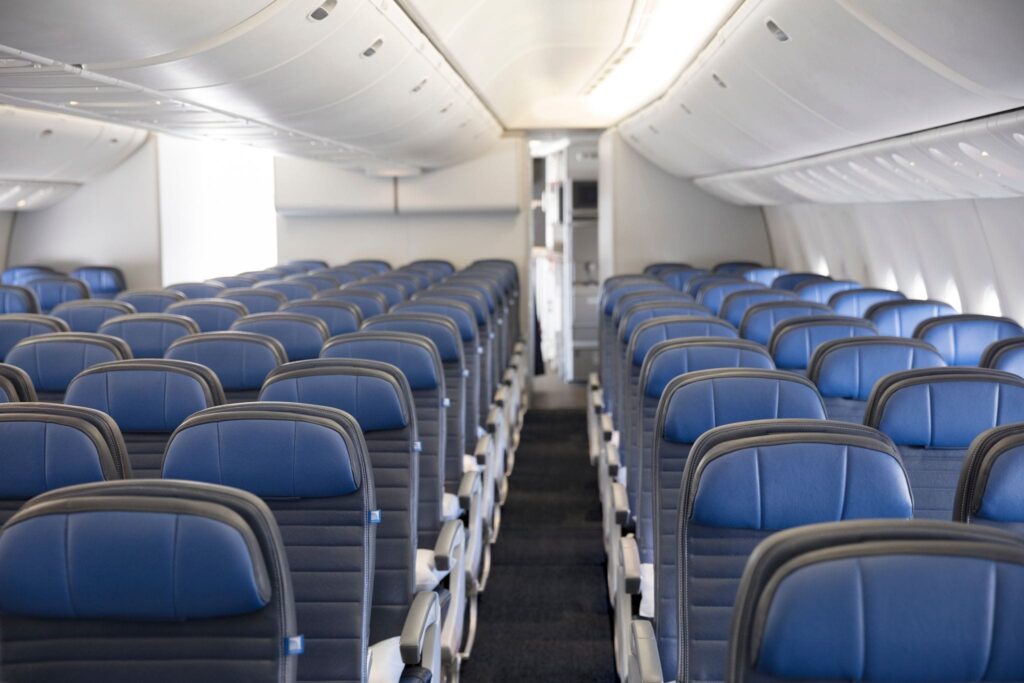
Photo: Courtesy of United Airlines
In North America, United Airlines has been the most successful major airline in increasing its average flight capacity since 2019 by adding an average of 21 seats per flight. This increase has been achieved despite scheduling around 12 percent fewer flights during the same period.
Meanwhile, American Airlines, Delta, and Southwest Airlines have also seen an increase in their average flight capacity since Q2 2019.
“In the United States, the collapse of regional jet services – with 36% fewer scheduled flights this coming quarter compared to 2019 – highlights the challenges that smaller airport locations are facing in the market; in parallel with increased low-cost airline activity, a 14% increase in average capacity per flight is not surprising,” says John Grant in his OAG report.
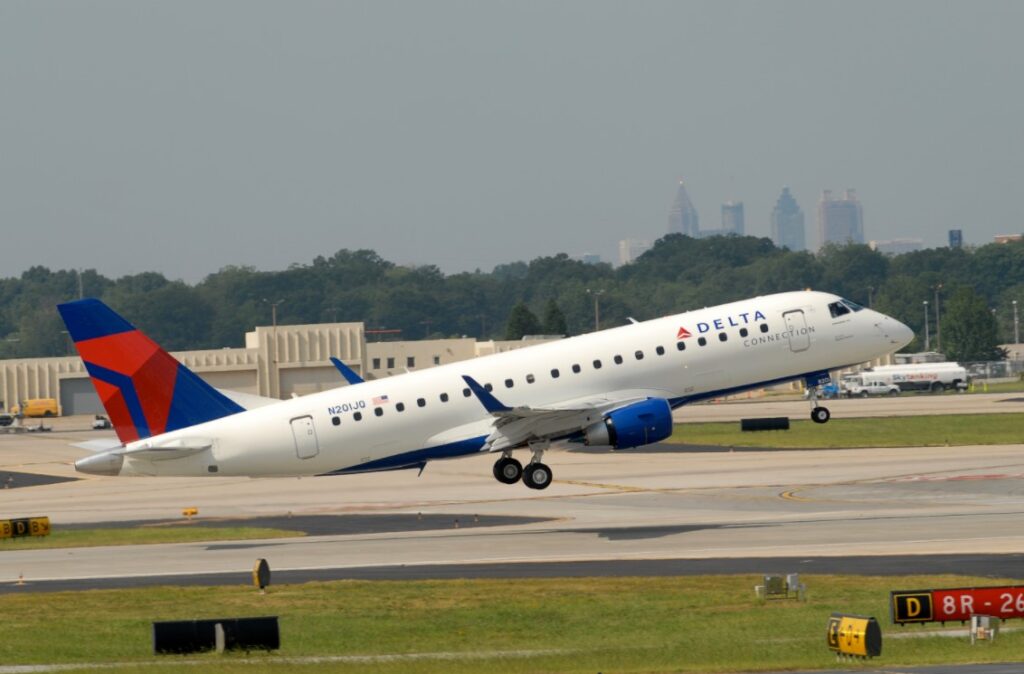
Photo: Delta, Embraer E175 Regional Jet. Courtesy of Delta
“With such a large increase in average capacity in the United States, it’s no surprise that the big four carriers are all offering more seats, United Airlines with an extra 21 seats per flight leading the way despite planning 12% fewer flights in Q2 compared to 2019,” Grant adds.
Central America and Central Asia, however, have seen the most significant number of seats per flight, with a 25 percent rise since Q2 2019.
European LCC Boost
In Europe, however, the ultra-low-cost carrier Ryanair is the leading airline in total average capacity, with 191 seats per flight. However, the airline has seen a relatively small rise of just 0.9 percent since Q2 2019.
In contrast, fellow low-cost carrier easyJet has experienced a 3.6 percent increase in its average flight capacity over the same period, with 180 seats per flight.
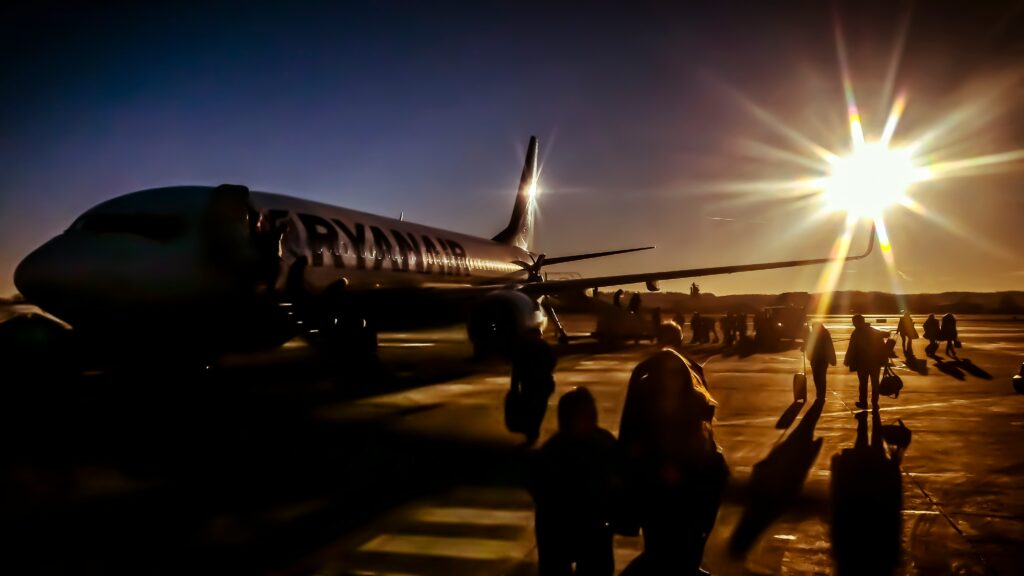
Photo: Ryanair, Boeing 737-800. Courtesy of Ludomił Sawicki / Unsplash
“At a country level, Spain has experienced the largest increase in capacity per flight with an 18% increase,” explains Grant, highlighting that this growth “is driven by increased low-cost airline activity in the country.”
“In comparison to Q2 2019, low-cost carriers like Ryanair have added 30% more capacity, leading to an inevitable overall increase in capacity per flight,” he says.
However, in Italy, the picture is quite different. “Perhaps unsurprisingly, amongst the ten largest country markets, Italy is the only one to see a slight reduction in average capacity per flight due to the latest reincarnation of the national airline [ITA Airways] having a significantly changed fleet mix – keeping the average very similar to 2019 levels.”
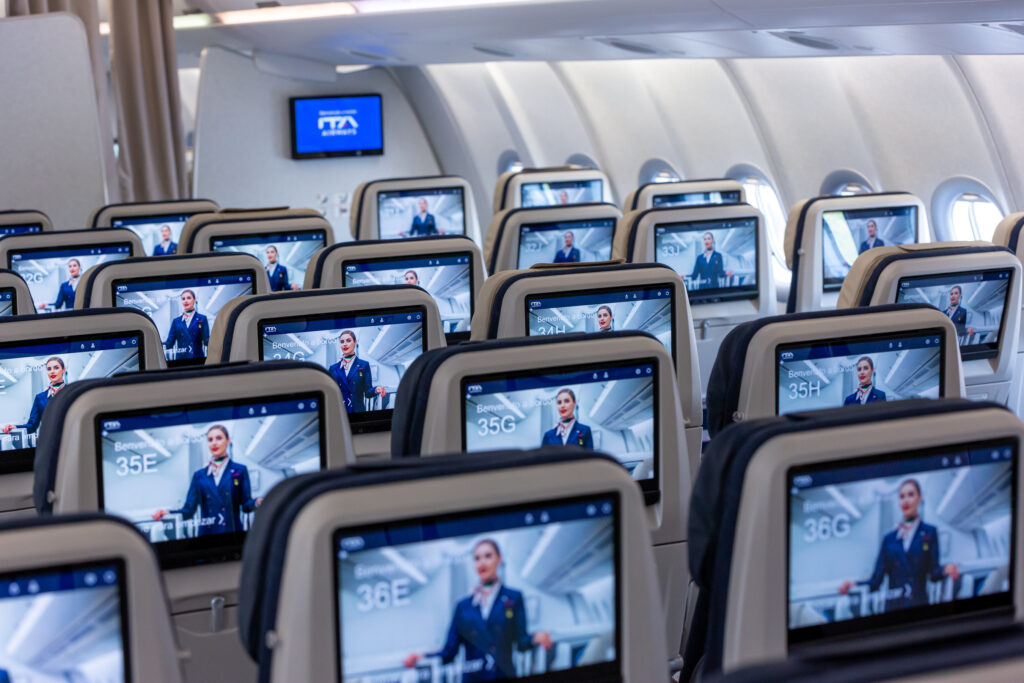
Photo: Economy Class seat, ITA Airways, Airbus A330neo. Courtesy of ITA Airways.
The national airline of Italy has implemented a mixed cabin approach on most of its planes, which includes economy, premium economy, and business class seating. This move has led to a reduction in the number of passengers per unit area and contradicts the findings of OAG’s study.
In contrast, low-cost and legacy carriers have increased seat density to battle the shortage of new aircraft and increase capacity per passenger.
Average available seats per flight:
| Airline | Average capacity per flight Q2 2019 | Average capacity per flight Q2 2023 | % Change |
|---|---|---|---|
| Ryanair | 189 | 191 | +0.9% |
| Air China | 185 | 186 | +0.5% |
| easyJet | 173 | 180 | +3.6% |
| China Southern Airlines | 174 | 178 | +2.5% |
| IndiGo | 171 | 178 | +4% |
| China Eastern Airlines | 167 | 167 | -0.1% |
| Southwest Airlines | 151 | 159 | +5.7% |
| Delta Air Lines | 125 | 141 | +13.2% |
| United Airlines | 111 | 132 | +18.8% |
| American Airlines | 112 | 128 | +14% |
In terms of total capacity, the North East Asia region leads the way with 339,359,407 seats in Q2 2024, a 9 percent increase compared to Q2 2019. North America follows closely behind with 335,896,996 seats this quarter, a 5.5 percent increase compared to five years ago. Western Europe had the third highest total capacity at 326,306,559 seats, a 1.9 percent increase on Q2 2019 levels.
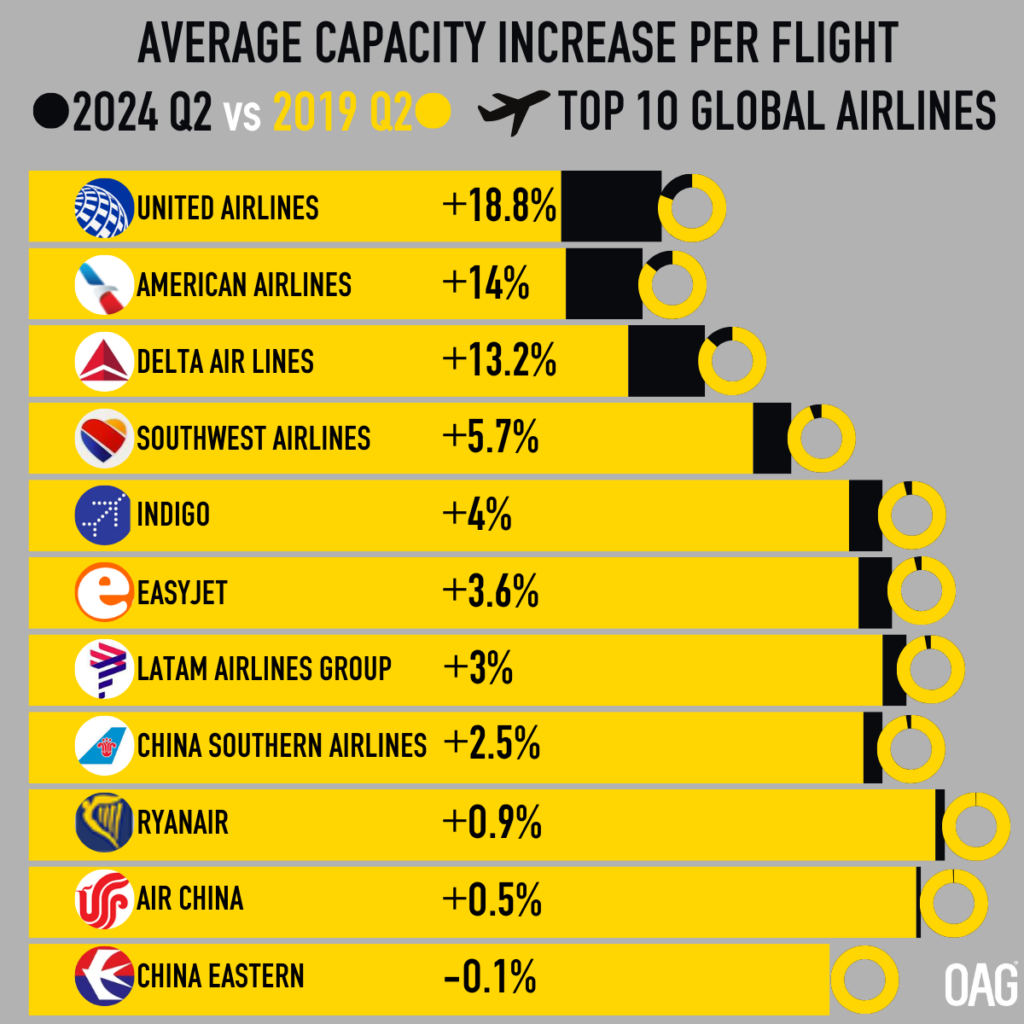
Chart: Courtesy of OAG
Interestingly, the fourth biggest region in terms of total capacity, South East Asia, has seen an 11.3 percent decrease in capacity over the same period, to 114,209,098 seats.
The United States leads the way with the highest capacity of any country, at 310,937,700 seats in Q2 2024, a 6.5 percent increase compared to Q2 2019. China has seen a bigger increase in capacity over this period, at 18.7 percent, but still lags in total capacity with 242,788,921 seats this quarter. The third biggest market, India, also saw a significant increase in capacity, rising by 16.8 percent to 58,852,527 seats in Q2 2024.