US Airports Struggle to Placate Traveler Woes Amid Construction Delays
Airports in Detroit, Portland and Indianapolis rank highest in respective segments

We have all seen the scaffolding and cranes, the walled off waiting areas and slowed movement of traffic around our favorite gateway airports lately. That might have something to do with U.S. Department of Transportation’s awards of some $986 million in airport infrastructure grants — the fifth allotment of the total $3.18 billion in Airport Improvement Program funding for airports across the United States.
These infrastructure improvements are happening as record passenger volumes force major expansion efforts. However, the road closures, confusing signage and delays that come with these projects are making it hard on passengers. That disruption is evident in the results of the J.D. Power 2019 North America Airport Satisfaction Study released today.
Overall passenger satisfaction with North American airports has risen only a single point (on a 1,000-point scale) year over year, following several years of steady improvement.
“With major terminal construction projects now underway in Los Angeles, Boston, Chicago, Atlanta and many other airports, it is becoming impossible for travelers not to experience some form of disruption,” said Michael Taylor, Travel Intelligence Lead at J.D. Power. “While these projects are absolutely necessary to address surging demand, they are currently causing passenger delays and confusion. This translates into a rushed passenger experience and less money spent on food, beverage and retail—and it’s slowing the progress of the airport satisfaction we’ve seen in the past several years.”
Following are some of the key findings of the 2019 study:
• Traveler satisfaction stagnates after several years of growth: The overall customer satisfaction score this year for North American airports is 762, up 1 point from 2018. The modest performance is attributable to lower-than-average facility access scores, with larger numbers of travelers citing construction-related delays getting into and out of the airport.
• Light at the end of the tunnel: The common bond among top-performing airports such as Detroit Metropolitan, Portland International and Indianapolis International is relatively new facilities that accommodate increased passenger volume, incorporate localized food and beverage offerings and offer easy access. Airports that can handle larger numbers of passengers while providing such experiences see a payoff in the form of improved satisfaction scores.
• Improved TSA processes, biometric screening improve security efficiency: The experience of getting through airport security—a perennial drag on airport satisfaction scores—has improved 5 points due to improved TSA processing and more widespread adoption of biometric screening technologies that move passengers through security faster.
Airport Satisfaction Rankings
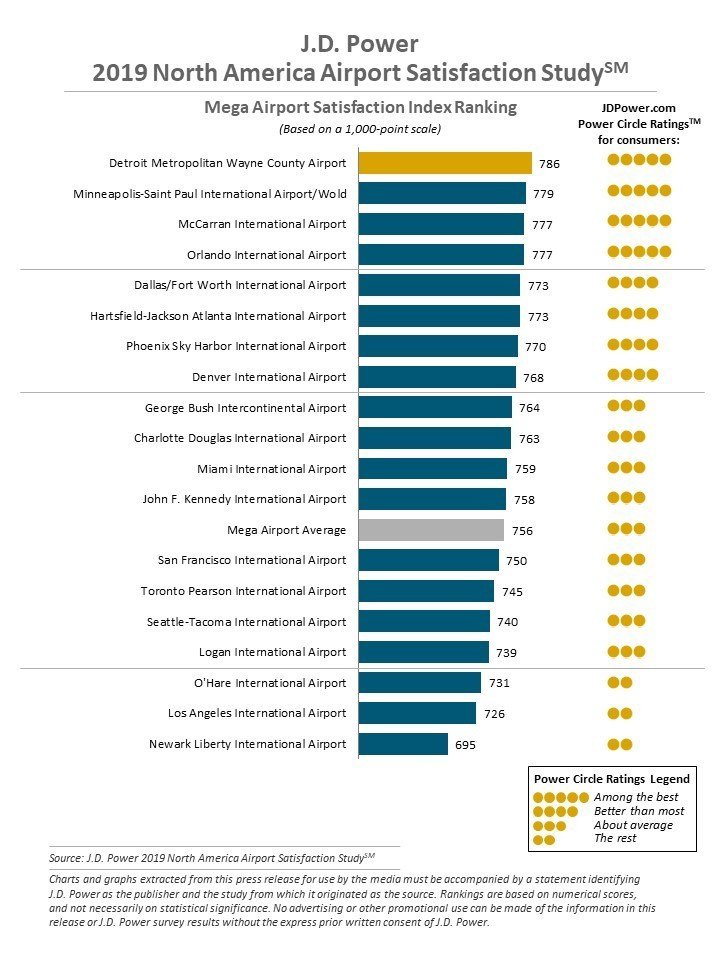
Detroit Metropolitan Wayne County Airport ranks highest in passenger satisfaction among mega airports with a score of 786. Minneapolis-Saint Paul International Airport/Wold (779) ranks second, while Las Vegas McCarran International Airport (777) and Orlando International Airport (777) rank third in a tie.
Portland (Ore.) International Airport ranks highest among large airports with a score of 833. Dallas Love Field (826) ranks second and Tampa International Airport (822) ranks third.
Indianapolis International Airport ranks highest among medium airports with a score of 833. Jacksonville International Airport (831) ranks second and Buffalo Niagara International Airport (829) ranks third.
The 2019 North America Airport Satisfaction Study measures overall traveler satisfaction with mega, large and medium North American airports by examining six factors (in order of importance): terminal facilities; airport accessibility; baggage claim; security check; check-in/baggage check; and food, beverage and retail. Mega airports are those having 33 million or more passengers per year; large airports have 10 to 32.9 million passengers per year; and medium airports have 4.5 to 9.9 million passengers per year.
The study, in its 14th year, is based on responses from 32,276 North American residents who traveled through at least one U.S. or Canadian airport and covers both departure and arrival experiences (including connecting airports) during the past three months. Travelers evaluated either a departing or arriving airport from their round-trip experience. The study was fielded from October 2018 through September 2019.