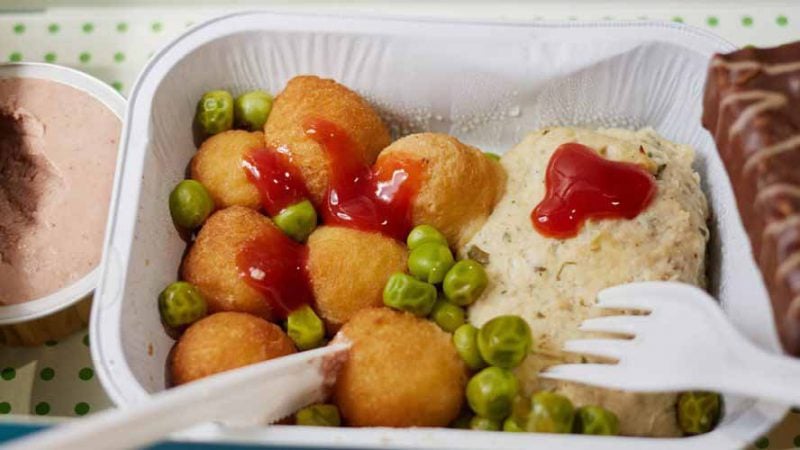
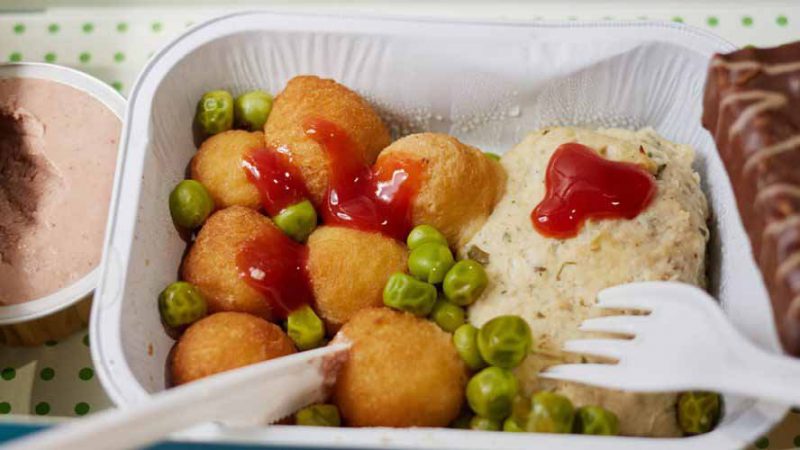
Airplane Food: Study Reveals the Truth in Airline Trays
Air Canada and Alaska are the best bets for hungry passengers who are concerned about calories and health
December 17, 2019


As more than 47 million passengers take to the skies this holiday season some might want to know what’s cooking in the galleys for weary travelers this Christmas.
A study produced by DietDetective.com, Hunter College NYC Food Policy Center and Airlines for America, surveyed the current airline landscape for what passes as healthy food options at 35,000 feet.
Knowing the “best” and “worst” choices is a valuable tool for any traveler, so Dr. Charles Platkin, editor of DietDetective.com and the Executive Director of the Hunter College NYC Food Policy Center. His team looked at the best “Calorie Bargains” and “Calorie Rip-offs” in the US airspace.
The recently released 2019-20 Airline Food Study, rated food options for eleven (11) airlines. The study assigned a “Health Score” (5 stars = highest rated, 0 star = lowest rated) based on criteria including:
• Healthy nutrients and calorie levels of meals, snack boxes and individual snacks
• level of transparency (display of nutrient information, menu online, ingredients),
• improvement and maintenance of healthy offerings
• menu innovation and cooperation in providing nutritional information, overall sodium levels, availability of meals on flights under 3 hours
The study includes health ratings, average calories per airline, comments, best bets, food offerings, costs, and nutrition information (e.g., calories, carbs, fats, protein, sodium and exercise equivalents).
Alaska and Air Canada shared the top spot this year as the airlines with the ‘healthiest’ food choices in the sky. Delta and JetBlue tied for second.
• Average Calories: The average number of calories per menu item was 373 calories in 2018 and this year it is almost the same at 375 calories. But keep in mind, calories are not everything; the study also looks at the nutrient content of these foods, as well as innovations moving towards healthier, tastier, less expensive and more sustainable choices.
• Food Footprint: Alaska Airlines is the clear leader in making strides to minimize its environmental impact. It was the first to replace plastic straws with paper ones and continues to look for eco-friendly substitutions. Alaska has also launched a #FillBeforeYouFly campaign to encourage flyers to bring their own water bottles and fill them up at water-filling stations in the airport to reduce the use of plastic cups and water bottles on board.
• Shame On You Award: This year it goes to Hawaiian Airlines for not providing ALL their nutritional information for the study, and to the EPA for not providing penalty information on galley water violations when requested.
• Sodium Matters: Sodium is often used by food providers to boost flavor, especially in the air where senses can be dulled. The average airline meal contains more than 800mg of sodium, which is more than 40 percent of the daily limit of 2000mg set by the World Health Organization. Also, note that in addition to health-related concerns, sodium can make you feel and look bloated because you retain extra water.
• Mini-Meals: Full meals or “mini-meal” options are better bets than eating individual snacks, which generally have little nutritional value.
• Short Flights Matter: The study recommends that airlines provide meals or allow for preorder on shorter flights so that passengers have the option to eat a healthy meal no matter how long they are in the air. A 90-minute flight can easily turn into a five- or six-hour travel experience when factoring in getting to the airport, TSA lines, delays, waiting for the flight to take off, deplaning and getting to the final destination.
• Need to Know: Transparency around food is important for airlines. This means providing an up-to-date version of its menu online with all nutrient information (i.e., calories, fat, carbs, sugar, fiber, protein and sodium), including ingredients.
• Taste Changes in Air: Research shows taste perception changes while in flight. Three factors impacting taste at such high altitudes are the lower cabin air pressure, lack of humidity and loud background noise. In-flight, air is recycled every few minutes and humidity is normally about 20 percent (compared to indoor relative humidity of 40 percent). With lower humidity and air pressure, we’re likely to be thirstier, and there’s naturally less moisture in the throat, which slows the transport of odors to the brain’s smell and taste receptors. Passengers are encouraged to drink a lot of water. More salt, sugar and flavor enhancers (i.e. spices and herbs) are necessary to make meals inflight taste the way they do on the ground.
• Carb Watch: Eating lots of heavy carbs such as pasta with thick, dense sauces, breads, muffins or cakes create lethargic, crankiness and a lack of satisfaction. Blood sugar levels spike and then fall, impacting mood, attitude and behavior.
Air Canada
Average Calories Overall (Individual Snacks, Snack Boxes, and Meals): 347
Average Individual Snack Calories: 308
Average Snack Box Calories: 590
Average Meal Calories: 376
Average Sodium Content Overall (Individual Snacks, Snack Boxes, and Meals): 544mg
Alaska Airlines
Average Calories Overall (Individual Snacks, Snack Boxes, and Meals): 359
Average Individual Snack Calories: 265
Average Snack Box Calories: 464
Average Meal Calories: 388
Average Sodium Content Overall (Individual Snacks, Snack Boxes, and Meals): 472mg
JetBlue Airways
Average Calories Overall (Individual Snacks, Snack Boxes, and Meals): 295
Average Individual Snack Calories: 120
Average Snack Box Calories: 392
Average Meal Calories: 460
Average Sodium Content Overall (Individual Snacks, Snack Boxes, and Meals): 547mg
Delta Airlines
Average Calories Overall (Individual Snacks, Snack Boxes, and Meals): 424
Average Individual Snack Calories: 172
Average Snack Box Calories: 560
Average Meal Calories: 495
Average Sodium Content Overall (Individual Snacks, Snack Boxes, and Meals): 780mg
United Airlines
Average Calories Overall (Individual Snacks, Snack Boxes, and Meals): 320
Average Individual Snack Calories: 186
Average Snack Box Calories: 463
Average Meal Calories: 431
Average Sodium Content Overall (Individual Snacks, Snack Boxes, and Meals): 464mg
American Airlines
Average Calories Overall (Meals, Snack Boxes and Individual Snacks): 481
Average Individual Snack Calories: 144
Average Snack Box Calories: 471
Average Meal Calories: 585
Average Sodium Content Overall (Meals, Snack Boxes and Individual Snacks): 678mg
Frontier Airlines
Average Calories Overall (Individual Snacks and Snack Boxes): 289
Average Individual Snack Calories: 298
Average Snack Box Calories: 257
Average Sodium Content Overall (Individual Snacks and Snack Boxes): 367mg
Allegiant Air
Average Calories Overall (Individual Snacks and Snack Boxes): 325
Average Individual Snack Calories: 390
Average Snack Box Calories: 240
Average Sodium Content Overall (Snack Boxes and Individual Snacks): 362mg
Spirit Airlines
Average Calories Overall (Individual Snacks and Snack Boxes): 360
Average Individual Snack Calories: 370
Average Snack Box Calories: 319
Average Sodium Content Overall (Individual Snacks and Snack Boxes): 450mg
Hawaiian Airlines
Average Calories Overall (Individual Snacks, Snack Boxes, and Meals): 556
Average Individual Snack Calories: 369
Average Snack Box Calories: 515
Average Meal Calories: 898
Average Sodium Content Overall (Individual Snacks, Snack Boxes, and Meals): 755mg
Southwest Airlines
Average Individual Snack Calories: 106
Average Sodium Content Overall (Individual Snacks): 135mg


