Top 20: London’s Six Airports Responsible for Highest Aviation Pollution
London is ranked first followed by Tokyo and Dubai, while Los Angeles and New York are the top cities in the United States
by Fergus Cole
March 4, 2024

Photo: Courtesy of Alex Muromtsev / Unsplash
With no less than six international airports, London is more affected by aviation pollution than any other city in the world, according to a new report produced by think tanks ODI and Transport & Environment.
The 2024 Airport Tracker report analyzed flight emission data from 1,300 international airports worldwide, considering both passenger flights and air freight. It tracked a combination of carbon (CO2) emissions, nitrous oxide (NOx) emissions, and fine particulate matter (PM2.5) from each airport to calculate what environmental and health impacts this had on each city these airports served.
While Dubai International Airport (DXB) was found to be the world’s most polluting with a total of 20.1 metric tons of CO2 emitted in 2019, London’s combination of six airports—Heathrow (LHR), Gatwick (LGW), Stansted (STN), Luton (LTN), City (LCY), and Southend (SEN)—means the U.K. capital is the world’s worst city for aviation-created air pollution.

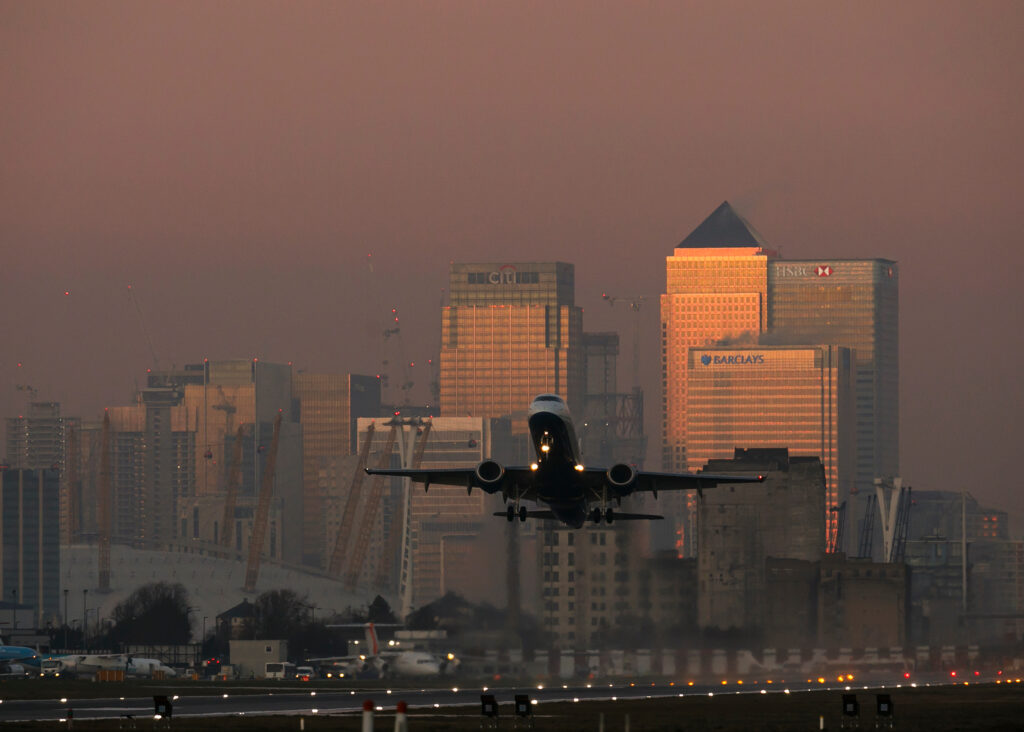
Photo: London City Airport. Courtesy of Andrew Baker
These airports emitted 8,861 tons of NOx and 83 tons of PM2.5 in 2019, the equivalent of 3.23 million passenger cars.
Dubai and Tokyo were the next worst affected cities, with an equivalent of 2.78 million cars emissions each.
The most polluted city from aviation emissions in the U.S. is New York, with John F. Kennedy International (JFK), Newark Liberty (EWR), and LaGuardia (LGA) producing emissions equivalent to 2.42 million cars. The only other cities in the U.S. to make the top 20 are Atlanta, Los Angeles, and Chicago.
Top 20 cities with most aviation pollution:
| Rank | City | Country | Airports | NOx |
|---|---|---|---|---|
| 1 | London | UK | 6 | 3.23 |
| 2 | Tokyo | Japan | 2 | 2.78 |
| 2 | Dubai | UAE | 2 | 2.78 |
| 4 | Shanghai | China | 2 | 2.60 |
| 5 | New York | United States | 4 | 2.42 |
| 6 | Beijing | China | 3 | 2.24 |
| 7 | Sao Paulo | Brazil | 3 | 2.12 |
| 8 | Bangkok | Thailand | 2 | 1.99 |
| 9 | Seoul | South Korea | 2 | 1.95 |
| 10 | Paris | France | 3 | 1.87 |
| 11 | Hong Kong | Hong Kong | 1 | 1.84 |
| 12 | Moscow | Russia | 3 | 1.81 |
| 13 | Atlanta | United States | 1 | 1.79 |
| 14 | Istanbul | Turkey | 2 | 1.68 |
| 15 | Singapore | Singapore | 1 | 1.61 |
| 16 | Guangzhou | China | 1 | 1.55 |
| 17 | Los Angeles | United States | 1 | 1.52 |
| 17 | Chicago | United States | 1 | 1.52 |
| 19 | Frankfurt | Germany | 2 | 1.46 |
| 20 | Taipei | Taiwan | 2 | 1.45 |
“Pollution around airports is growing year on year,” said Jo Dardenne, aviation director at Transport & Environment. “It affects millions of people, who breathe in toxic emissions and develop health conditions as a result, yet policymakers are brushing the problem under the carpet.
“Exponential growth of the sector and airports is incompatible with their climate goals, especially considering the slow uptake of clean technologies. The sector led us to believe that they would bounce back better after the pandemic. They’ve certainly bounced back – but without action, the sector’s climate and health impact isn’t going to get any better.”
The report also broke down the most polluting airports by region, with Los Angeles International Airport (LAX) revealed to be the worst in North America, emitting a total of 18.7 metric tons of CO2 in 2019. This was followed by JFK in second place and Chicago O’Hare (ORD) in third.
Top 20 U.S. cities with most aviation pollution:
| Rank | Airport | Total CO2 |
|---|---|---|
| 1 | Los Angeles (LAX) | 18.7 |
| 2 | New York John F. Kennedy (JFK) | 14.7 |
| 3 | Chicago O’Hare (ORD) | 11.2 |
| 4 | San Francisco (SFO) | 11.1 |
| 5 | Atlanta Hartsfield-Jackson (ATL) | 9.7 |
| 6 | Dallas/Fort Worth (DFW) | 8.3 |
| 7 | Newark Liberty (EWR) | 8.1 |
| 8 | Toronto Pearson (YYZ) | 7.7 |
| 9 | Memphis (MEM) | 7.5 |
| 10 | Miami (MIA) | 7.4 |
| 11 | Anchorage (ANC) | 6.9 |
| 12 | Louisville (SDF) | 6.3 |
| 13 | Seattle/Tacoma (SEA) | 6.2 |
| 14 | Houston George Bush (IAH) | 5.7 |
| 15 | Denver (DEN) | 5.3 |
| 16 | Boston Logan (BOS) | 5.0 |
| 17 | Honolulu (HNL) | 4.7 |
| 18 | Vancouver (YVR) | 4.6 |
| 19 | Philadelphia (PHL) | 4.5 |
| 20 | Washington Dulles (IAD) | 4.4 |


